Story Points Estimation: Planning Poker and Velocity
Short answer
Story points estimation is relative, not hourly. The team picks a small, well-understood reference story as 2 or 3 points and sizes new stories against it. In Planning Poker everyone reveals a Fibonacci card at once and outliers explain their view. Past sprint velocity then turns the remaining backlog into a forecast range.
Ron Jeffries, one of the creators of Extreme Programming, may have invented story points. He’s not proud of it. In a 2019 post he wrote that he might have suggested renaming “ideal days” to “points”, and added that if he did, he’s sorry now.
The backstory explains a lot. Jeffries’ XP team estimated in ideal days and multiplied by a load factor of about three to get real days. Stakeholders couldn’t understand why a “day” took three days, so the ideal day became a point. The new unit was meant to remove confusion. These days it often creates more.
Used properly, story points still work well. Properly mostly means relatively.
Why relative sizing beats absolute guesses
People are bad at saying how long something will take. They’re decent at saying whether one thing is about twice as big as another. Story points exploit that: the team compares each new story with stories it already knows.
One number bundles three things: the amount of work, its complexity and its risk. That’s why a story with little code but an unknown third-party API can score higher than one with lots of routine work.
Step 1: agree on reference stories
Without a shared yardstick, every estimate is arbitrary. Pick two or three finished stories that the whole team remembers:
| Reference story | Points | Why |
|---|---|---|
| Add a required “phone number” field to the profile, with validation | 2 | small, familiar, little risk |
| Password reset flow with emailed link | 5 | several parts, known technology |
| CSV import of customer records with an error report | 13 | many edge cases, data quality unknown |
Keep this table visible in every estimation session. Hold each new story against it. Smaller than the password reset? Bigger than the phone field?
Step 2: Planning Poker
James Grenning described Planning Poker in 2002, and Mike Cohn later made it popular. The mechanics are simple, with one clever idea at the core: everyone picks a card privately and reveals at the same moment. That stops the group anchoring on whoever speaks first.
- Present the storyThe product owner reads the story and acceptance criteria and answers questions.
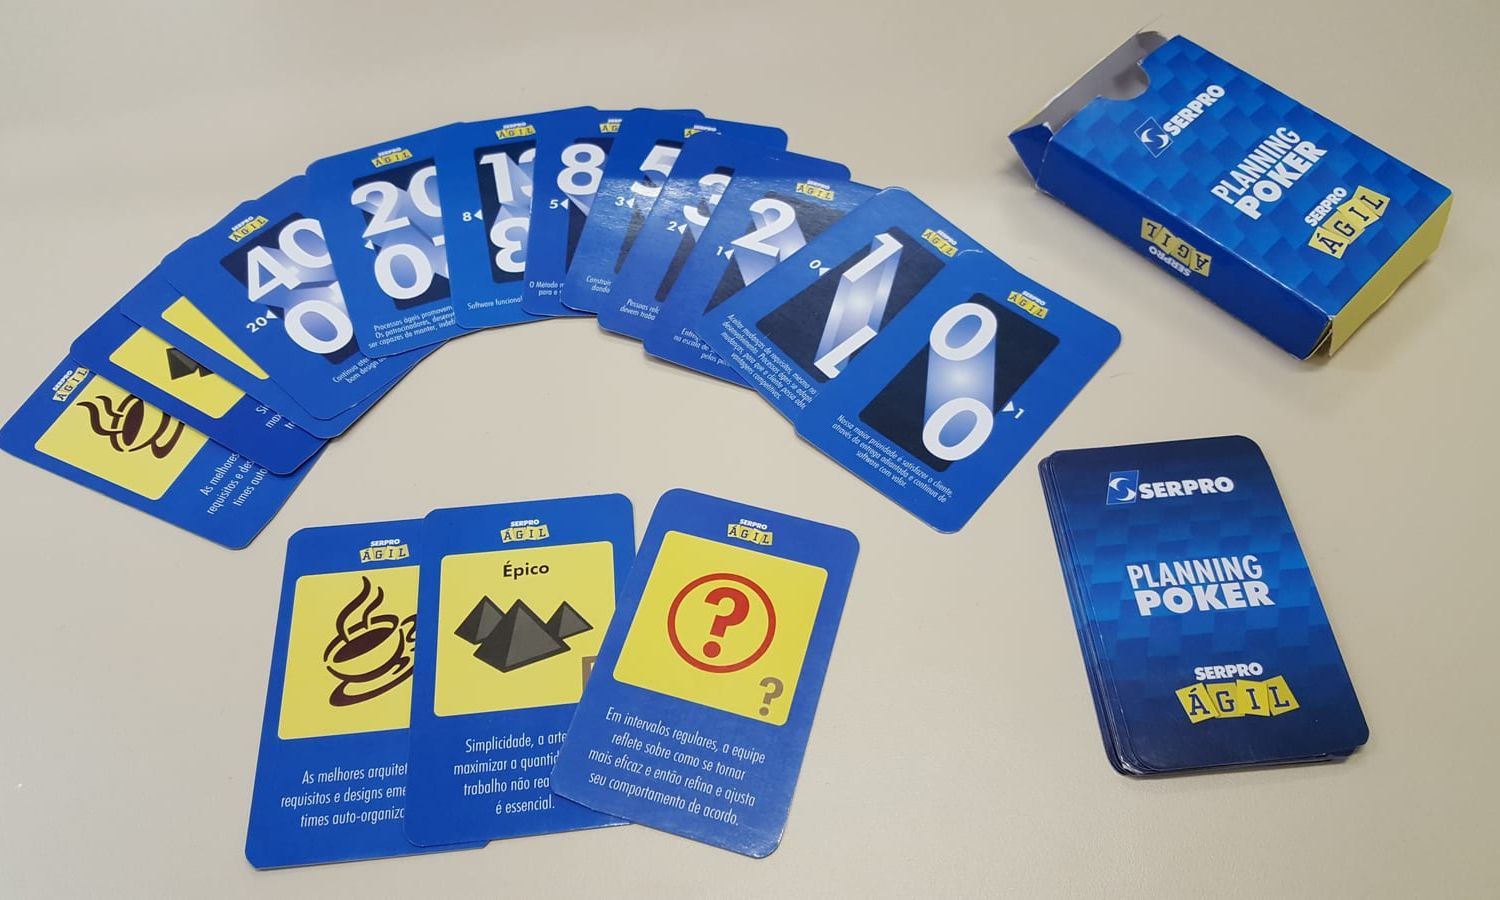
- Choose privatelyEveryone picks a card. Typical values: 1, 2, 3, 5, 8, 13, 20, 40, 100.
- Reveal togetherAll cards flip on a signal.
- Explain outliersHighest and lowest explain their reasoning. Often one person knows something others missed.
- Estimate againSecond round. The group usually converges now.
- RecordWrite the number down. No agreement after three rounds means the story is too unclear and goes back.
Why Fibonacci-style numbers? Because the gaps grow with size. Distinguishing 2 from 3 is useful. Distinguishing 20 from 21 is false precision. The cards force the team to stay coarse on big items, which matches the real uncertainty. Some decks add a question mark and a coffee cup for “can we take a break”.
Good stories come first. Without acceptance criteria, everyone sizes something different. See how to write user stories.
Step 3: measure velocity and forecast
Velocity is the sum of points a team actually finishes per sprint. Finished means meeting the Definition of Done, not “nearly there”. After three to five sprints you have a usable baseline.
Say a team completed 21, 25, 18, 27, 22 and 24 points over six two-week sprints, and 240 points remain in the backlog.
- Best sprint: 240 ÷ 27
- 9 sprints
- Mean: 240 ÷ 22.8
- 11 sprints
- Worst sprint: 240 ÷ 18
- 14 sprints
- Forecast with two-week sprints
- 18 to 28 weeks
Example figures. The range comes from the worst and best sprints; the mean is 22.8 points.
That range is more honest than any single date. It says completion could fall anywhere from about four to seven months out, and it narrows with each sprint. When new stories join the backlog, remaining scope grows and the forecast moves. That’s not a flaw. It’s precisely the information management needs.
For budgeting you can translate points into money, but only at team level: the cost of one sprint divided by average velocity gives a cost per point. Use it for forecasts, never for pricing individual stories. For estimating before any velocity data exists, see software estimation techniques.
Four common ways to misuse story points
Velocity as a performance target
Tell a team to deliver more points and stories start getting bigger estimates. Velocity rises; output doesn’t.
Converting points to hours
Declare that one point equals six hours and you’ve reinvented hourly estimates with an extra step.
Comparing teams
Thirty points for one team and fifty for another say nothing about productivity. The yardsticks differ.
Counting half-finished work
Eighty percent done counts as zero points. Otherwise velocity gets flattered and the forecast drifts away from reality.
That sounds strict. It has a useful side effect: teams learn to slice stories smaller, because a big story slipping past the sprint end visibly dents velocity. Small stories are easier to plan, and the forecast becomes reliable sooner. Teams that keep pulling 13-point stories into sprints should work on splitting before they work on estimating.
When you can drop story points
The 2020 Scrum Guide prescribes no estimation method. It only says the Developers doing the work are responsible for sizing it. Some mature teams simply count stories per sprint after splitting everything to a similar size. That works as long as stories stay consistently small, around two or three days of work each.
For new teams, or backlogs where story sizes vary wildly, points remain the better tool. They’re a poor fit for contracts with outside vendors, since the unit only means something inside one team. Contracts need days or budgets, as discussed in fixed price vs time and materials.
Hiring an external team? Ask to see their sprint-by-sprint history instead of an average velocity. Studios like OnlineBuilders describe how they work in the open, which is a fair benchmark for any vendor’s transparency.
Next step: at your next planning session, agree on three reference stories and pin the table where everyone can see it. Planning Poker only pays off after that.
Questions people ask
How many hours is one story point?
There's no fixed conversion, and that's the point. Story points measure size and complexity relative to other stories. Introduce a fixed rate and you're estimating in hours again under a different name.
Can you compare story points across teams?
No. Each team has its own reference stories, so 8 points means something different in every team. Comparing velocity between teams almost always leads to point inflation.
Does Scrum require story points?
No. The 2020 Scrum Guide doesn't mention story points at all. It only says the Developers who do the work are responsible for sizing it.
What does a 40 or 100 card mean?
The story is too big or too vague to estimate meaningfully. Treat it as an epic and split it before it goes into sprint planning.